Happy Pi day! As is the tradition at the University of Maryland (and to a certain extent, in my family) we are celebrating March 14 with pie and Pi. A shoutout to @konstantinosx who, during last year’s Pi day, requested blueberry pie, which was the strangest pie request I’ve received for Pi day. Not that blueberry pie is strange, just that someone would want one so badly for Pi day (he got a mixed berry pie).
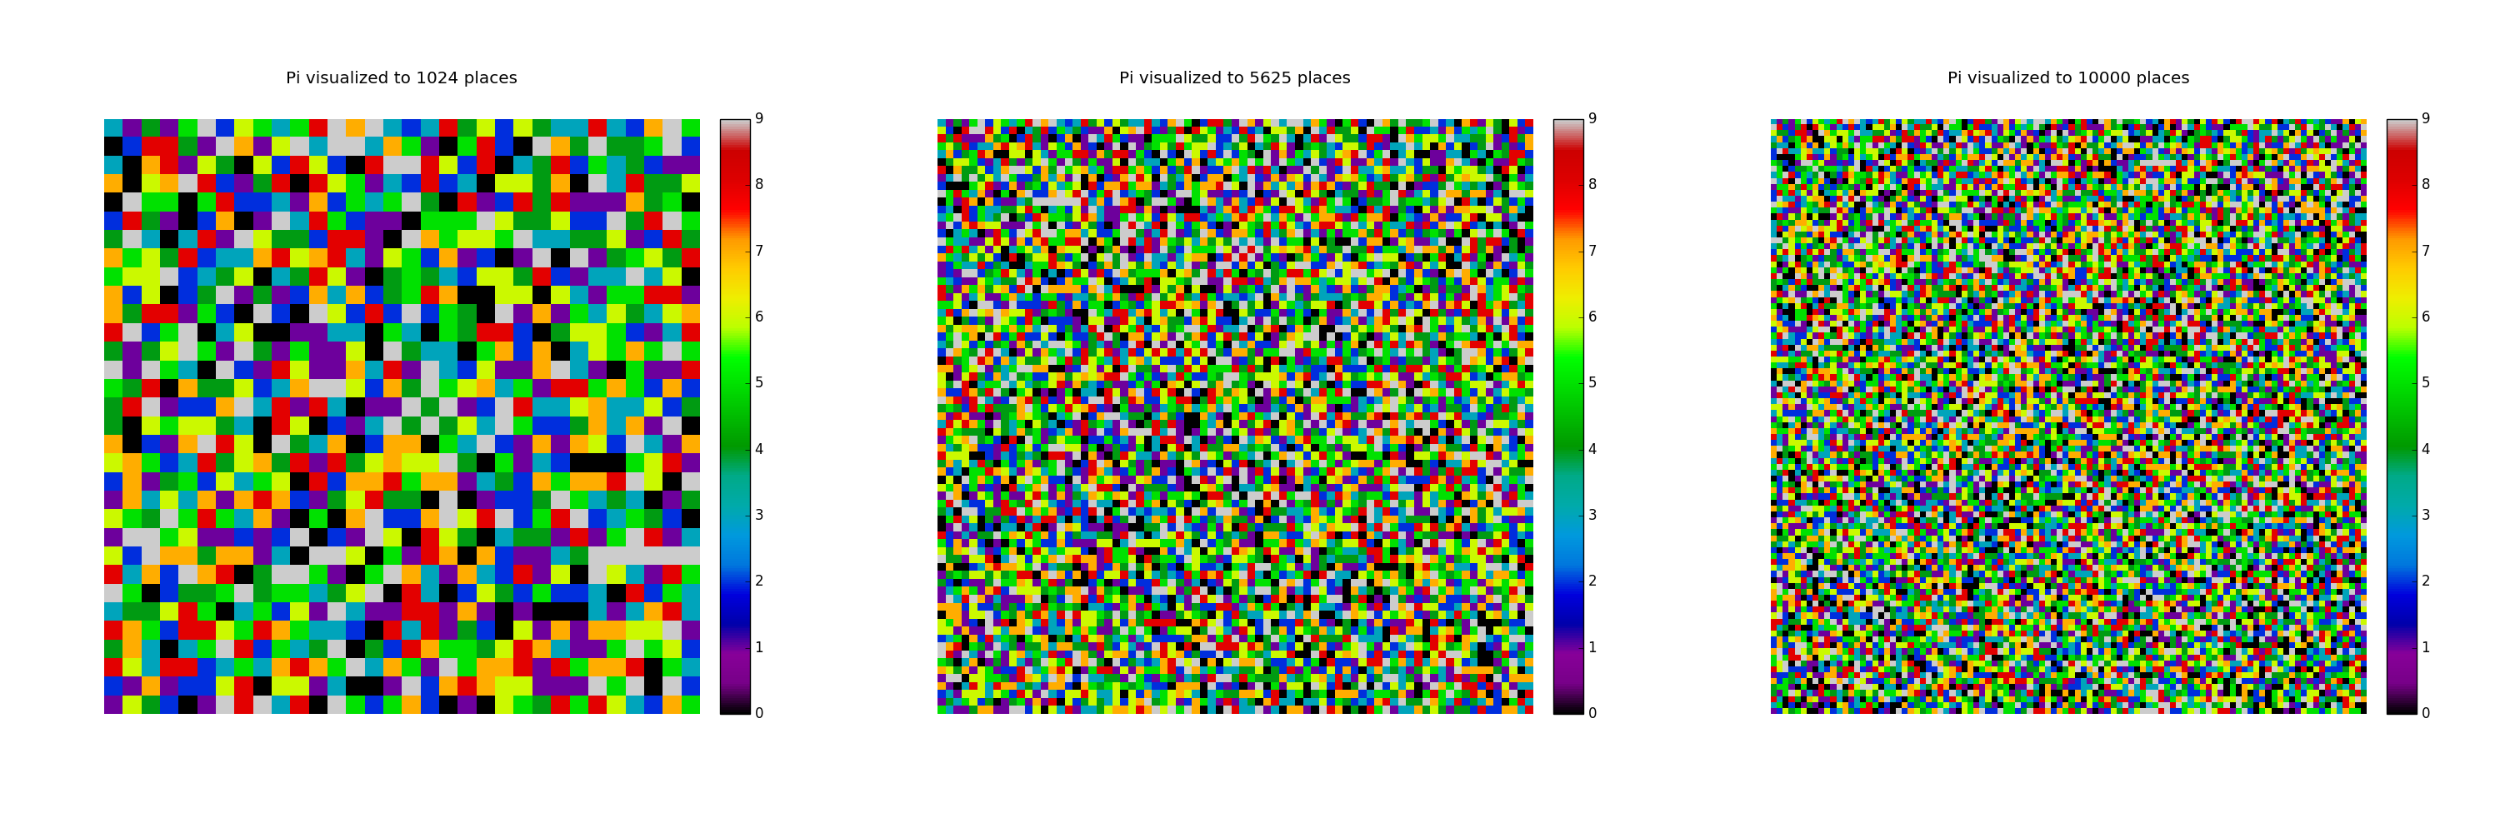
In honor of Pi day, I’ve created a simple a grid visualization of the digits of Pi, computed using the Chudnovsky algorithm with Python. The grid is displayed using some simple matplotlib code (yes, this is what “simple” matplotlib code looks like). This unfortunately took a bit longer than expected (see updates below), but in the end, I ended up with the following visualizations for 1024, 5625, and 10000 digits of Pi:
UPDATE 0: 1,024 digits took 16.052 seconds, even though 10,000 and 5,625 digits went into “Python not responding” mode after 3-4 minutes. Noticed no significant memory or CPU usage. Going to just let the 5k digits run for now.
UPDATE 1: 5,625 digits took 3053.405 seconds (about 51 minutes) on my Macbook Pro. (10k digits running now).
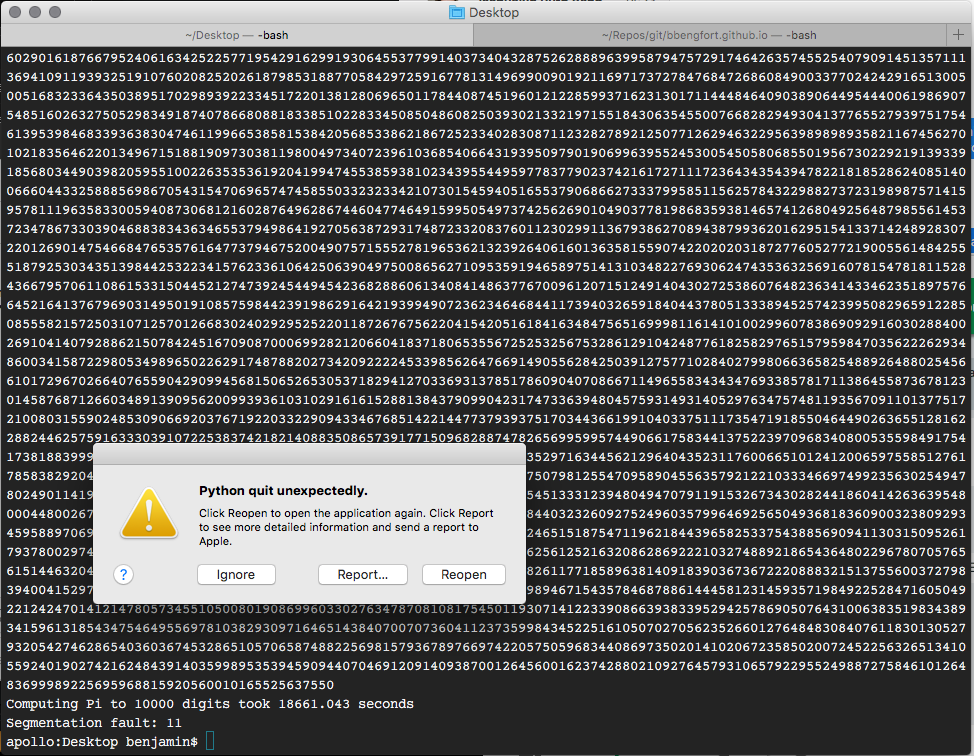
UPDATE 2: 10,000 digits took 18661.043 seconds (5 hours, 11 minutes), all the digits printed out, but the visualization caught a
SEGFAULT. Seriously, matplotlib? Anyway, a quick copy and paste of the digits saved the viz!
The Python script that does the work of generating both Pi and the grid are as follows:
The Pi digits computation uses the decimal.Decimal data structure in Python as well as setting a context to ensure that we lose no information by overflowing a float or a double precision data type. This code isn’t my own, see the Stack Overflow link in the comment for more on it.
The visualization is done using the matshow function in matplotlib, which I’ve used in the past to visualize cellular automata and even animate them with matplotlib. It simply assigns a color from the color map to each digit and fills in the appropriate square. I don’t like the color map — but I didn’t take the time to put together a categorical colormap with a better scheme (sorry).
Appendix: SEGFAULT
So this happened after 5 hours of computing Pi:
Appendix: Compute Times
Compute times were as follows:
| digits | time (sec) | accuracy |
|---|---|---|
| 1024 | 16.052 | TBD |
| 5625 | 3053.405 | TBD |
| 10000 | 18661.043 | TBD |