This week I discovered graph-tool, a Python library for network analysis and visualization that is implemented in C++ with Boost. As a result, it can quickly and efficiently perform manipulations, statistical analyses of Graphs, and draw them in a visual pleasing style. It’s like using Python with the performance of C++, and I was rightly excited:
It's a bear to get setup, but once you do things get pretty nice. Moving my network viz over to it now!
— Benjamin Bengfort (@bbengfort) June 24, 2016
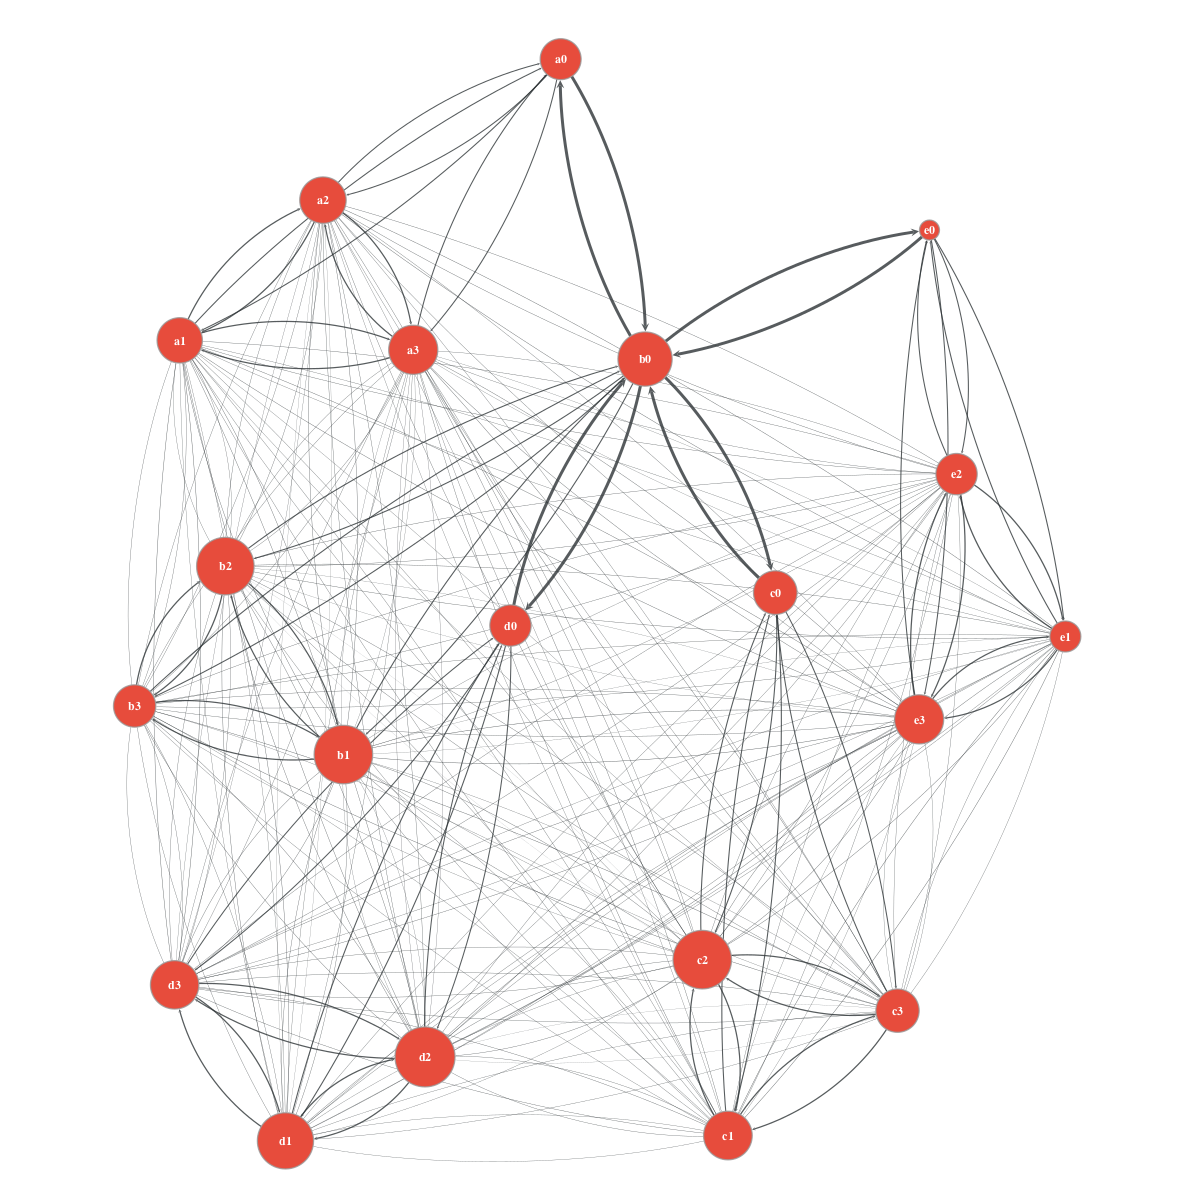
The visualization piece also excited me; as I tweeted, graph-tool sits between matplotlib and Gephi. It does a better job than matplotlib at the visualization, including things like edge curvature and directionality markers that are very difficult to do in native matplotlib. The graphs are very comparative to Gephi renderings, though it is probably a lot easier to do in Gephi then coding in graph-tool.
Because graph-tool is a C++ implementation, you can’t simply pip install it (giant bummer). I used homebrew to install it, and got it working outside of a virtual environment. I am not sure how to add it to a virtualenv or to the requirements of a project yet, but I imagine I will simply lazy load the module and raise an exception if a graph tool function is called (or gracefully fallback to NetworkX).
Ok, enough loving on graph-tool. Let’s do what we came here to do today, and that’s convert a NetworkX graph into a graph-tool graph.
Converting a NetworkX Graph to Graph-Tool
Both NetworkX and Graph-Tool support property graphs, a data model that allows graphs, vertices, and edges to have arbitrary key-value pairs associated with them. In NetworkX the property graphs are implemented as a Python dictionary, and as a result, you can use them just like you’d use a dictionary. However, in graph-tool these properties are maintained as a PropertyMap, a typed object that must be defined before the property can be added to a graph element. This and other C++ requirements make graph-tool Graphs a harder to generate and work with, though the results are worth it.
First a note:
import networkx as nx
import graph_tool.all as gt
We will refer to networkx as nx and graph-tool as gt and prefix variables accordingly, e.g. nxG and gtG refer to the networkx and graph-tool graphs respectively. The snippet is long, but hopefully well commented for readability.
As you can see, converting a networkx graph or indeed even creating a graph-tool graph is very involved primarily because of the typing requirements of the C++ implementation. We haven’t even dealt with pitfalls like other Python objects like datetimes and the like. In case you didn’t want to inspect the code in detail, the phases are as follows:
- Create a graph-tool graph, using
is_directedto determine the type. - Add all the graph properties from
nxG.graph - Iterate through the nodes and add all their properties
- Create a special
idproperty for nodes since nx uses any hashable type - Iterate through the edges and add all their properties
- Iterate through the nodes (again) and add them and their values to the graph
- Iterate through the edges, use a look up to add them and their values
Potentially there is a mechanism to clean up and make this better, faster or stronger - but I think the main point is to illustrate how to get graph-tool graphs going so that you can use their excellent analytics and visualization tools!