Normal distributions are the backbone of random number generation for simulation. By selecting a mean (μ) and standard deviation (σ) you can generate simulated data representative of the types of models you’re trying to build (and certainly better than simple uniform random number generators). However, you might already be able to tell that selecting μ and σ is a little backward! Typically these metrics are computed from data, not used to describe data. As a result, utilities for tuning the behavior of your random number generators are simply not discussed.
I wanted to be able to quickly and easily predict what would happen as I varied μ and σ in my distribution. These are easy to think about: if you picture the normal curve, then μ describes where the middle of the curve is. If you want to have data centered around 100, then you would choose a μ of 100. Standard deviation describes how spread out the data is, or how tall or flat the normal curve is above the mean. A standard deviation of zero would be a spike right at the mean, where as a very high standard deviation will be extremely flat with a wide range.
Remembering that ±3σ from the mean captures most of the data from the random generator, I set up creating a visual way to inspect the properties and behaviors of the normal generators I was creating. In particular, my goal is to visually inspect the range of the data, as well as the density of results. This helps debug issues in simulations. Therefore, I give you a normal distribution simulation:
By running this simply Python script:
$ python norm.py 12.0 2.0
You end up with visuals as follows:
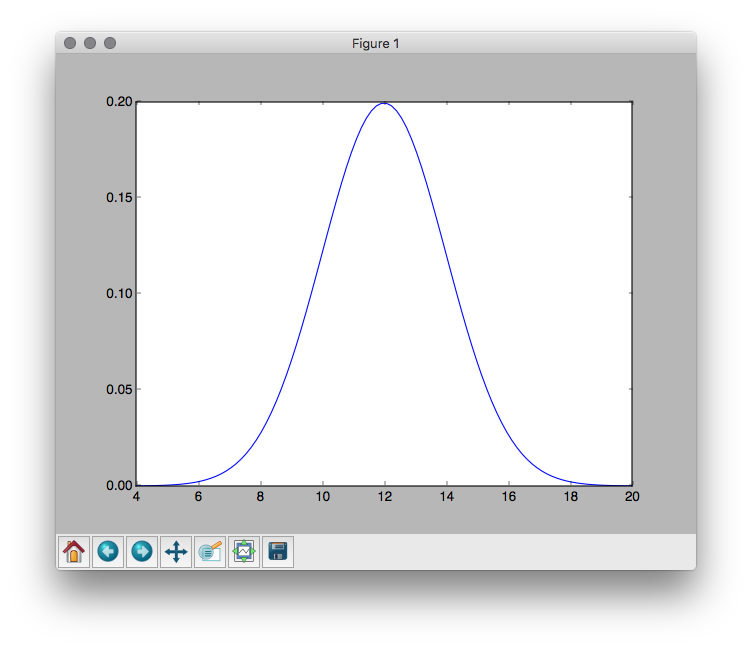
Shifting the mean and increasing the standard deviation gives you the following:
$ python norm.py 14 12.4
Which, as you can see, definitely changes the scale of the domain of the random number generator!
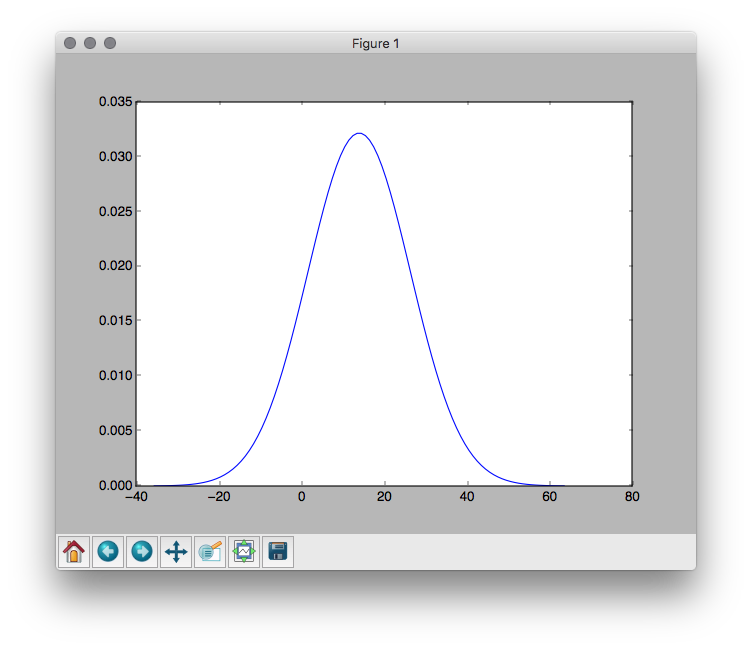
It may be hard to see - but check out the domains of both axes to get a feel for the magnitude of that change! Now you have a simple and effective way to reason about how μ and σ might change the way that random numbers are selected!