In this post I wanted to catalog the process of an open source contribution I was a part of, which added a feature to the memory profiler Python library by Fabian Pedregosa and Philippe Gervais. It’s a quick story to tell but took over a year to complete, and I learned a lot from the process. I hope that the story is revealing, particularly to first time contributors and shows that even folks that have been doing this for a long time still have to find ways to positively approach collaboration in an open source environment. I also think it’s a fairly standard example of how contributions work in practice and perhaps this story will help us all think about how to better approach the pull request process.
The bottom line is that a feature that was relatively quick to prototype took a long time to get included into the main code, even though there was a lot of interest. The hangup involved all the normal excuses (too busy, worried the code wasn’t good enough, etc.) but in the end it was effective, clear, and positive communication that finally made things come together. Here’s how it went down in timeline form:
July 13, 2016: asked a Stack Overflow question: How to profile multiple subprocesses using Python multiprocessing and memory_profiler?
Unfortunately I can’t remember exactly why I was asking this, but my best guess is that I was trying to determine memory usage either for the minke parallel NLP application or to do some benchmarking for my research simulations. There are unfortunately no blog posts around that time that hint at what I was doing.
July 14, 2016: submitted a feature request, mprof each child process independently, to the memory_profiler repository.
At this point, I received some feedback from @fabianp directing me to some specific locations in code where I might start making changes. Unfortunately I don’t know where those comments were added, potentially in an another issue? I forked the project and began a proof of concept.
July 16, 2016: proof of concept, mpmprof created in my repository fork.
I submitted a comment on the issue to ask @fabianp to take a look at my fork. He (correctly) asked for a pull request. However, I was unsure that my proof of concept was good enough for a PR and asked for help and got a minor comment in return. I decided to try to fix it and I made a critical mistake: I didn’t submit the PR.
August 4, 2016 - March 18, 2017: the contribution silence occurs.
Pings and plus ones from @cachedout and @davidgbe bring the project up to my attention again, but it feels like a daunting amount of work, so things stay silent.
March 18, 2017: finally I submit a “work in progress (WIP)” pull request, WIP: Independent child process monitoring #118.
This pull request is very brief and simply has my original contribution along with a massive fork update to get to the latest code. However, it is finally at this point that @fabianp takes a look at my code. He asks me to merge my proof of concept into the codebase.
March 20, 2017: I address the merge request with a very simple implementation, code review begins.
The code review is a back and forth conversation between @fabianp and I. He tests and runs the example code on his machine, and takes a look at the modifications I made specifically. Any changes or updates requested I can commit to my fork and they are automatically included in the pull request.
March 21, 2017: my submitted pull request is merged.
We ended up going back and forth a few times, discussing the impact of multiprocessing on various components and a pickle error that cropped up. The conversation was very good and it led to quite a few updates to the code, and even a couple of changes from @fabianp. Throughout I became more confident since he was looking at the PR and testing it.
March 22, 2017: new release of memory_profiler on PyPI.
The release was posted on PyPI along with a nice thank you on Twitter. I can finally answer my own question on Stack Overflow!
Thanks to @bbengfort memory_profiler can now separately track memory usage of forked processes https://t.co/LCOMLgNzM8 pic.twitter.com/Lc46lf0xs8
— Fabian Pedregosa (@fpedregosa) March 22, 2017
So let me break down what happened here and do a bit of a post-mortem. First, I had a problem that I wanted to solve with an existing, popular, and well-used codebase (namely track the memory usage of child processes independently to the main process). I thought there must be a way to do this, and while there was a solution to a variant of my problem, there was no direct solution.
Next, I decided to fix the problem and start a conversation. I was able to (relatively quickly) create a concept that solved my problem. In fact, it worked so well that I used that solution for a little under a year. I thought that by maintaining my solution in my fork, other folks were able to leverage it.
However, there was a problem: I wasn’t able to contribute back to the main library. So let’s look at what held me back:
- The changes to the primary module were modest but the changes to the implementation were drastic
- Fear that I had broken something unrelated since there weren’t a lot of tests
- Style clash: how I write code is different from how this module is constructed.
- It was easier for me to write my proof of concept outside the original module
Specifically, I was able to make the modifications to memory_profiler.py (the library for the code base) by adding a function and modifying the control flow of the primary entry point. This felt relatively safe and non-invasive. However, modifying the command-line script, mprof required a lot more work. It was simpler and faster for me to write my own command line script, mpmprof rather than modify the original version.
Frankly, if you compare mprof and mpmprof I think it’s pretty obvious that there are two drastically different coding styles at work here. I use the argparse library, have things structured functionally rather than with if/else control syntax, have a different docstring implementation, more intermediate functions, use regular expressions for parsing, and have a bit more exception handling (just to name a few notable differences). However, I also did not have a complete implementation from the other code, nor did I completely understand all the problems the original code was trying to solve.
I thought I faced a problem about whether I should update the code to use argparse and “more modern” syntax (there was even an related pull request) or to potentially introduce breaking changes by trying to stay as close to the original as possible. I even considered forking the project and creating my own, potentially more easily maintained-by-me version. I worried that I was being a jerk by overhauling the code, or not contributing “the right way”. But really the problem was that I wasn’t engaging the authors of the library in a meaningful discussion.
So what would I do next time to solve the problem? Open a pull request as soon as possible.
Maybe I thought Fabian would go checkout my fork or maybe I let the list of barriers hold me back, but whatever the case not submitting a PR meant that I couldn’t engage the authors in a discussion about my contribution. I had heard the PR ASAP advice before, but it hasn’t been until recently that I have fully understood what GitHub and the code review tools allow you to do. Contribution is collaboration and the PR workflow helps you get there!
I haven’t fully implemented all of my changes to the code base (again, for the reasons outlined above) but now, if you run:
$ pip install -U memory_profiler
$ mprof run -M python examples/multiprocessing_example.py
$ mprof plot
You’ll get a figure that looks something similar to:
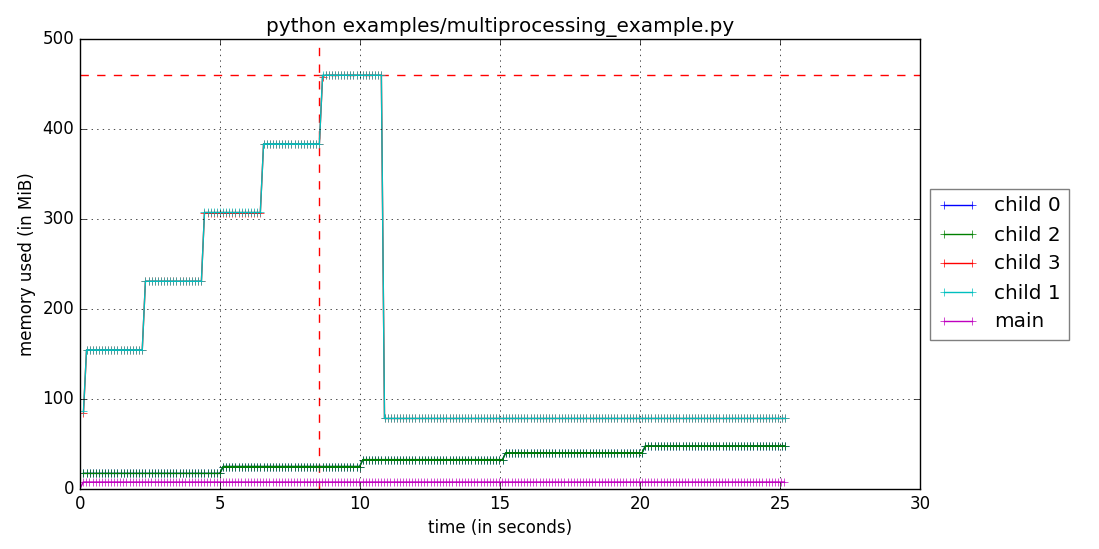
This is great news for an oft-requested feature of a library that is well used and well maintained. For reference, if you’d like to see an example of my proof of concept, you can check out my fork, or see my version of the mprof script on Gist. However, you don’t have to worry about that gist, and can instead simply pip install memory_profiler to get access to this feature!