This post serves as a reminder of how to perform benchmarks when accounting for synchronized writing in Go. The normal benchmarking process involves running a command a large number of times and determining the average amount of time that operation took. When threads come into play, we consider throughput - that is the number of operations that can be conducted per second. However, in order to successfully measure this without duplicating time, the throughput must be measured from the server’s perspective.
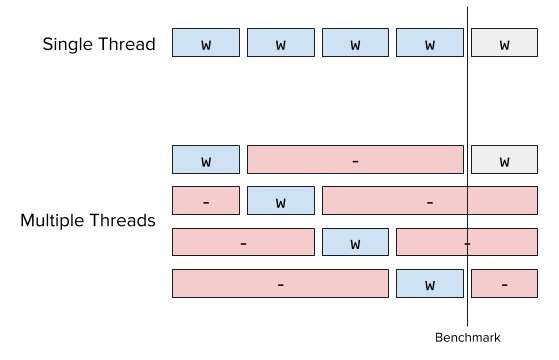
Let w be the amount of time a single operation takes and n be the number of operations per thread. Given t threads, the cost for each operation from the perspective of the client thread will be t*w because the server is synchronizing writes as shown in the figure above, e.g. the thread has to wait for t-1 other writes to complete before conducting it’s write. This means that each thread returns a latency of n*t*w from it’s perspective. If this is aggregated, the total time is computed n*w*t^2, even though the real time that has passed is actually n*t*w as shown in the single threaded case.
For normal server-client throughput we measure the start time of the first access on the server end and the end time of the last access and the duration as the difference between these two timestamps. We then compute the number of operations conducted in that time to measure throughput. This only works if the server is pegged, e.g. it is not waiting for requests.
However, for synchronization we can’t measure at the server since we’re trying to determine the cost of locks and scheduling. We’ve used an external benchmarking procedure that may underestimate throughput but allows us to measure from the client-side rather than at the server. I’ve put up a simple library called syncwrite to benchmark this code.
Here is the use case: consider a system that has multiple goroutines, each of which want to append to a log file on disk. The append-only log determines the sequence or ordering of events in the system, so appends must be atomic and reads to an index in the log, idempotent. The interface of the Log is as follows:
type Log interface {
	Open(path string) error
	Append(value []byte) error
	Get(index int) (*Entry, error)
	Close() error
}
The log embeds sync.RWMutex to ensure no race conditions occur and that our read/write invariants are met. The Open, Append, and Close methods are all protected by a write lock, and the Get method is protected with a read lock. The structs that implement Log all deal with the disk and in-memory storage in different ways:
InMemoryLog: appends to an in-memory slice and does not write to disk.FileLog: on open, reads entries from file into in-memory slice and reads from it, writes append to both the slice and the file.LevelDBLog: both writes and reads go to a LevelDB database.
In the future (probably in the next post), I will also implement an AsyncLog that wraps a Log and causes write operations to be asynchronous by storing them on a channel and allowing the goroutine to immediately return.
Benchmarks
The benchmarks are associated with an action, which can be one or more operations to disk. In this benchmark we simply evaluate an action that calls the Write method of a log with "foo" as the value. Per-action benchmarks are computed using go-bench, which computes the average time it takes to run the action once:
BenchmarkInMemoryLog-8   	10000000	       210 ns/op
BenchmarkFileLog-8       	  200000	      7456 ns/op
BenchmarkLevelDBLog-8    	  100000	     12379 ns/op
Writing to the in-memory log is by far the fastest, while writing to the LevelDB log is by far the slowest operation. We expect throughput, that is the number of operations per second, to be equivalent with these per-action benchmarks in a single thread. The theoretical throughput is simply 1/w*1e-9 (converting nanoseconds to seconds). The question is how throughput changes with more threads and in a real workload.
Throughput benchmarks are conducted by running t threads, each of which run n actions and returns the amount of time it takes all threads to run n*t actions. As the t increases, the workload stays static, e.g. n becomes smaller to keep n*t constant. The throughput is the number of operations divided by the duration in seconds.
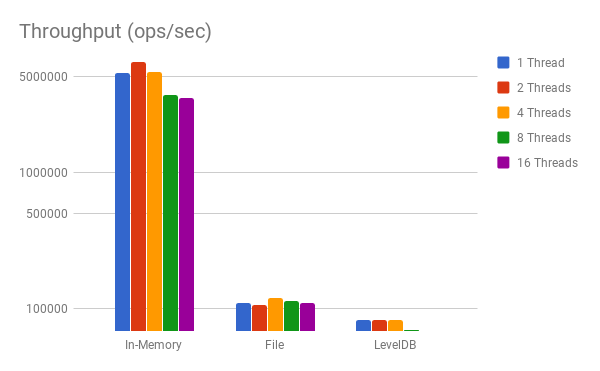
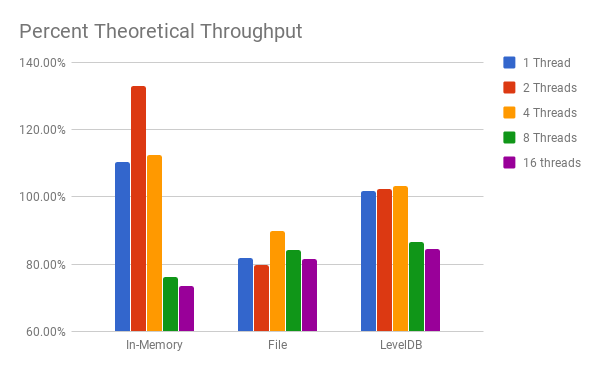
Note that the y-axis is on a logarithm scale, and because of the magnitude of in-memory writes, the chart is a bit difficult to read. Therefore the next chart shows the percentage of the theoretical throughput (as computed by w) the real system achieves:
Observations
Looking at the percent theoretical chart, I believe the reason that both In-Memory and LevelDB achieve >100% for up to 4 threads is because the benchmark that computes w has such a high variability; though this does not explain why the File log has dramatically lower throughput.
Because the benchmarks were run on a 4 core machine, up to 4 threads for In-Memory and LevelDB can operate without a noticeable decrease in throughput since there is no scheduling issue. However, at 8 threads and above, there is a noticeable drop in the percent of theoretical throughput, probably due to synchronization or scheduling issues. This same drop does not occur in the File log because it was already below it’s theoretical maximum throughput.