Good software development achieves complexity by describing the interactions between simpler components. Although we tend to think of software processes as step-by-step “wizards”, design and decoupling of components often means that the interactions are non-linear. So why should our software project planning be defined in a linear progression of steps with time estimates? Can we plan projects using a non-linear workflow that mirrors how we think about component design?

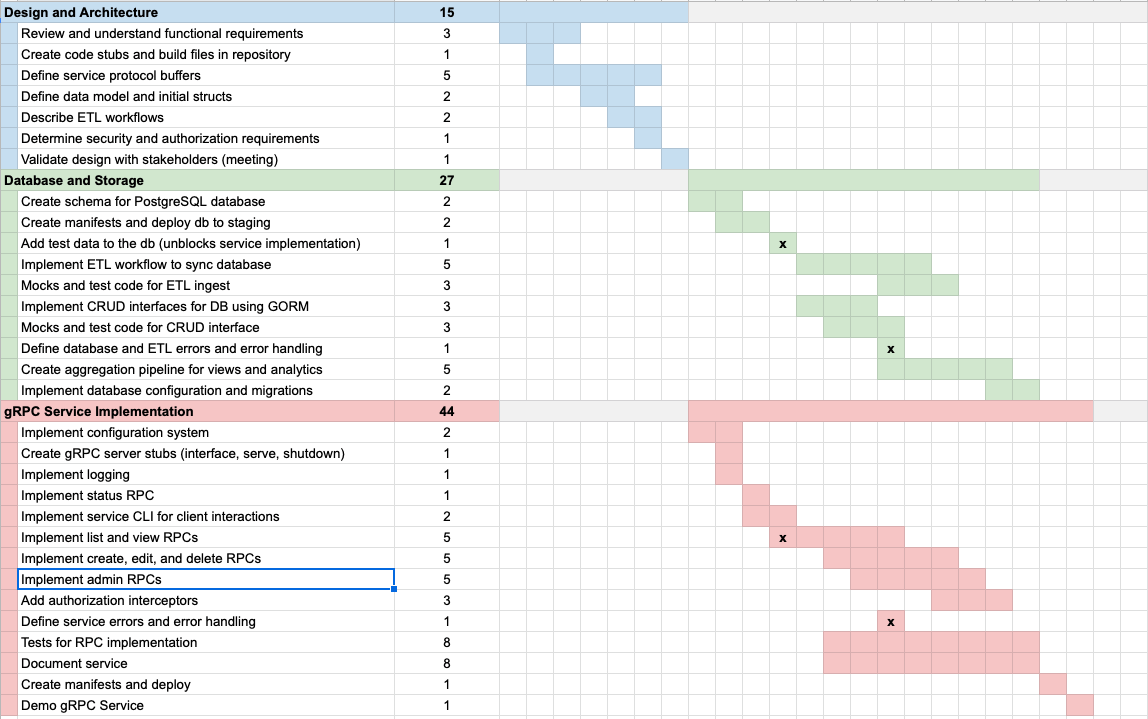
The figure above is an experiment in task planning that I recently used to try to describe the complex dependencies between different tasks in a project. On the left are a 2-level hierarchy of tasks that represent decomposition in the planning process - first major tasks are described, then subtasks for each major task can be planned out. Each task is assigned a level of work estimate - in this case using Fibonacci numbers, though I think t-shirt sizes would also work well. So far, so normal - the novelty comes from the Gantt-esque chart on the right.
The temporal chart shows blocks of time that corresponds to one unit of estimated work. If a task is estimated at 3 points, then it takes three blocks in the temporal chart. Unlike Gantt charts, however, the blocks of time do not represent clock or calendar time, but instead represent “happens before” relationships. E.g. in the green section, “Create schema for PostgreSQL database” and “Create manifests and deploy DB to staging” must be completed before “Add test data to the db (unblocks service implementation)”. Tasks that are coupled or related are also shown by overlapping time, e.g. “Create schema” and “Create manifests” are overlapping tasks - there is work that can be done in parallel between the schema and the manifests, but at some point the manifests need the schema in order to be complete.
By describing the relationships between tasks in this way, dependencies between tasks become quickly apparent without specifying a DAG or other relationship diagram. Tasks that can be completed in parallel allow team members to collaborate effectively, while overlapping tasks need the more focused effort of an individual contributor. Although this temporal chart seems to describe a waterfall of development effort - I believe that it’s flexibility lends itself to agile development workflows since these dependencies can make sprint planning simpler.
Consider that in an agile software development workflow, requirements and tasks are added to a backlog, then during sprint planning, those tasks are prioritized and added to a discrete sprint. Dependencies between tasks are often described by “blockers”. This process works well for more mature projects where each task tends to be self-contained. However, I’ve observed two issues with this process: first, team-members tend to focus on their own projects and second, it’s very difficult to plan projects beyond a single sprint, particularly right at the beginning of a project. Instead, I envision more focused sprint planning where the only tasks that are considered are the tasks that are available at the point in the temporal flow chart at the time of the sprint, and as many tasks as there are points available in the sprint are collected into it.
There are some issues: dependencies between subtasks are easy to describe, but dependencies across subtasks in different major tasks are more difficult. To show this I’ve added “x” marks to dependent subtasks in across major tasks, but it would be better if the relationships across major tasks could be trusted. Also, if used in sprint planning, this temporal flow chart would have to be dynamic; showing the actual vs predicted relationships and able to add new major tasks and subtasks as the project continued.
I think it would be interesting to prototype a planning tool that allowed you to easily add major tasks and subtasks with time estimates. Then by simply clicking on a block the time would be filled in. The major task would automatically be updated with the full estimate and the time window it’s in. Groups of tasks could be moved left or right together. This level of interactivity would make planning much more effective!